
Interface tour
Interface tour
Ironbullet is organized around a visual pipeline canvas. Add a block, configure it in the inspector, then use Debug mode to inspect the response and variables before creating a multi-threaded job. The capture below focuses on authoring; run output appears after an execution and is not visible in this static screenshot.
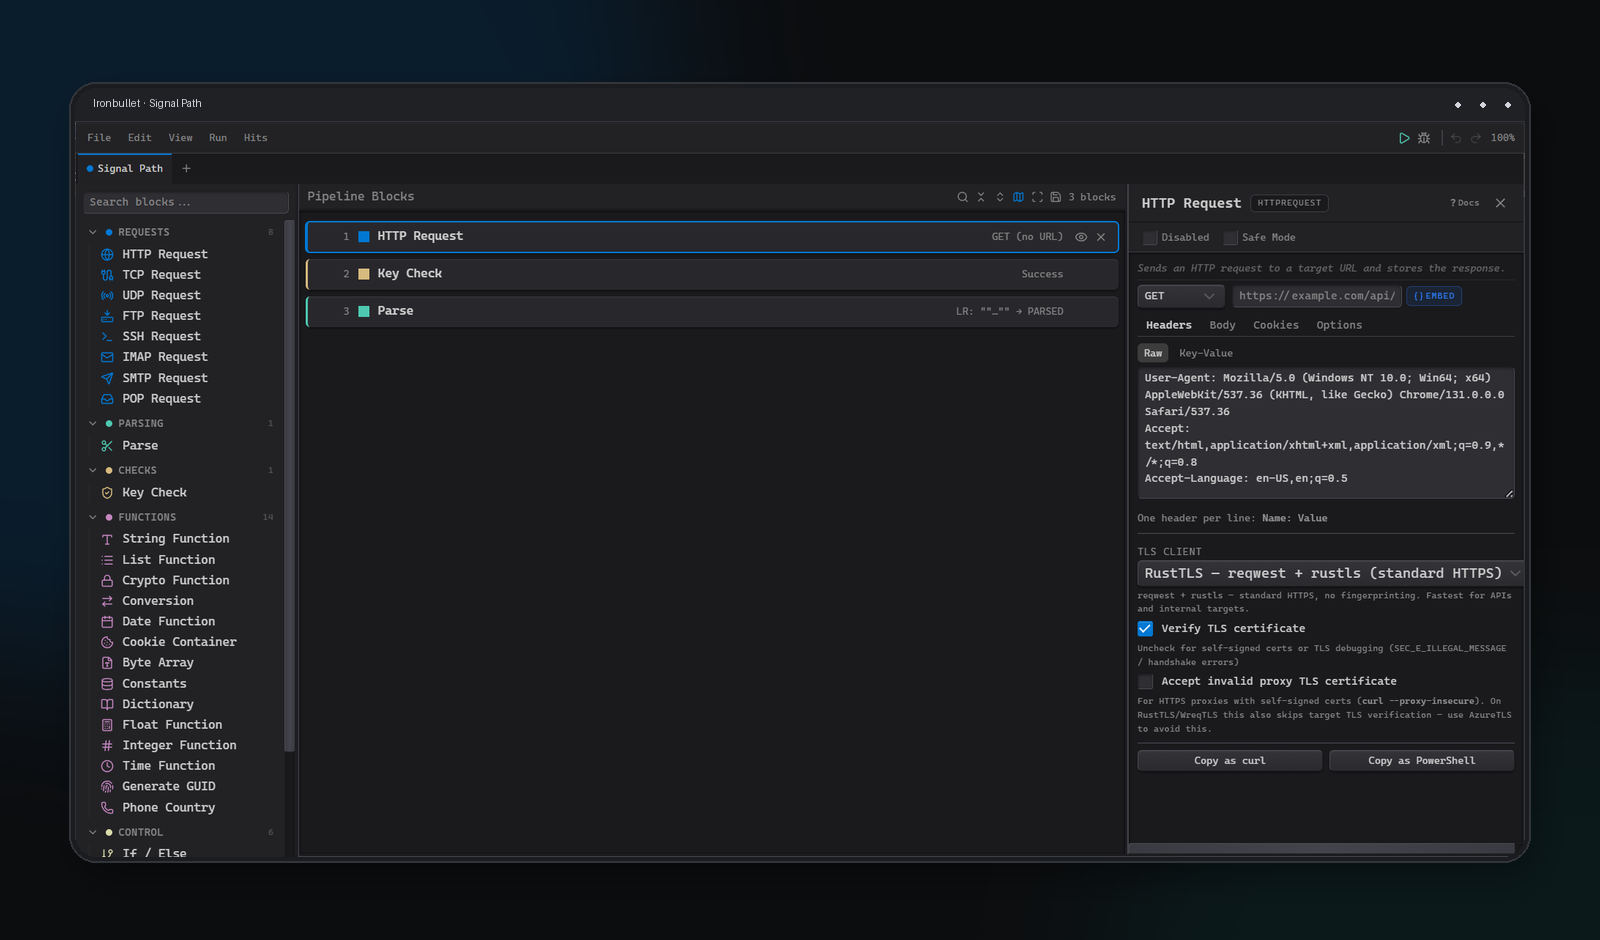
1. Block Palette
The Block Palette is the left-side library of blocks that can be added to a new pipeline. Expand a category, select a block, then add it to the canvas. The Block reference uses the same category vocabulary as the palette.
- Start new pipelines with entries marked Palette in the block reference.
- Entries marked Compatibility-only remain documented for imported configurations but are not palette options.
- Use the palette search when the block type is known but its category is not.
2. Pipeline canvas
The center canvas contains the ordered execution path. A block runs after the block above it unless it is inside a control-flow block such as If / Else, Loop, or Group.
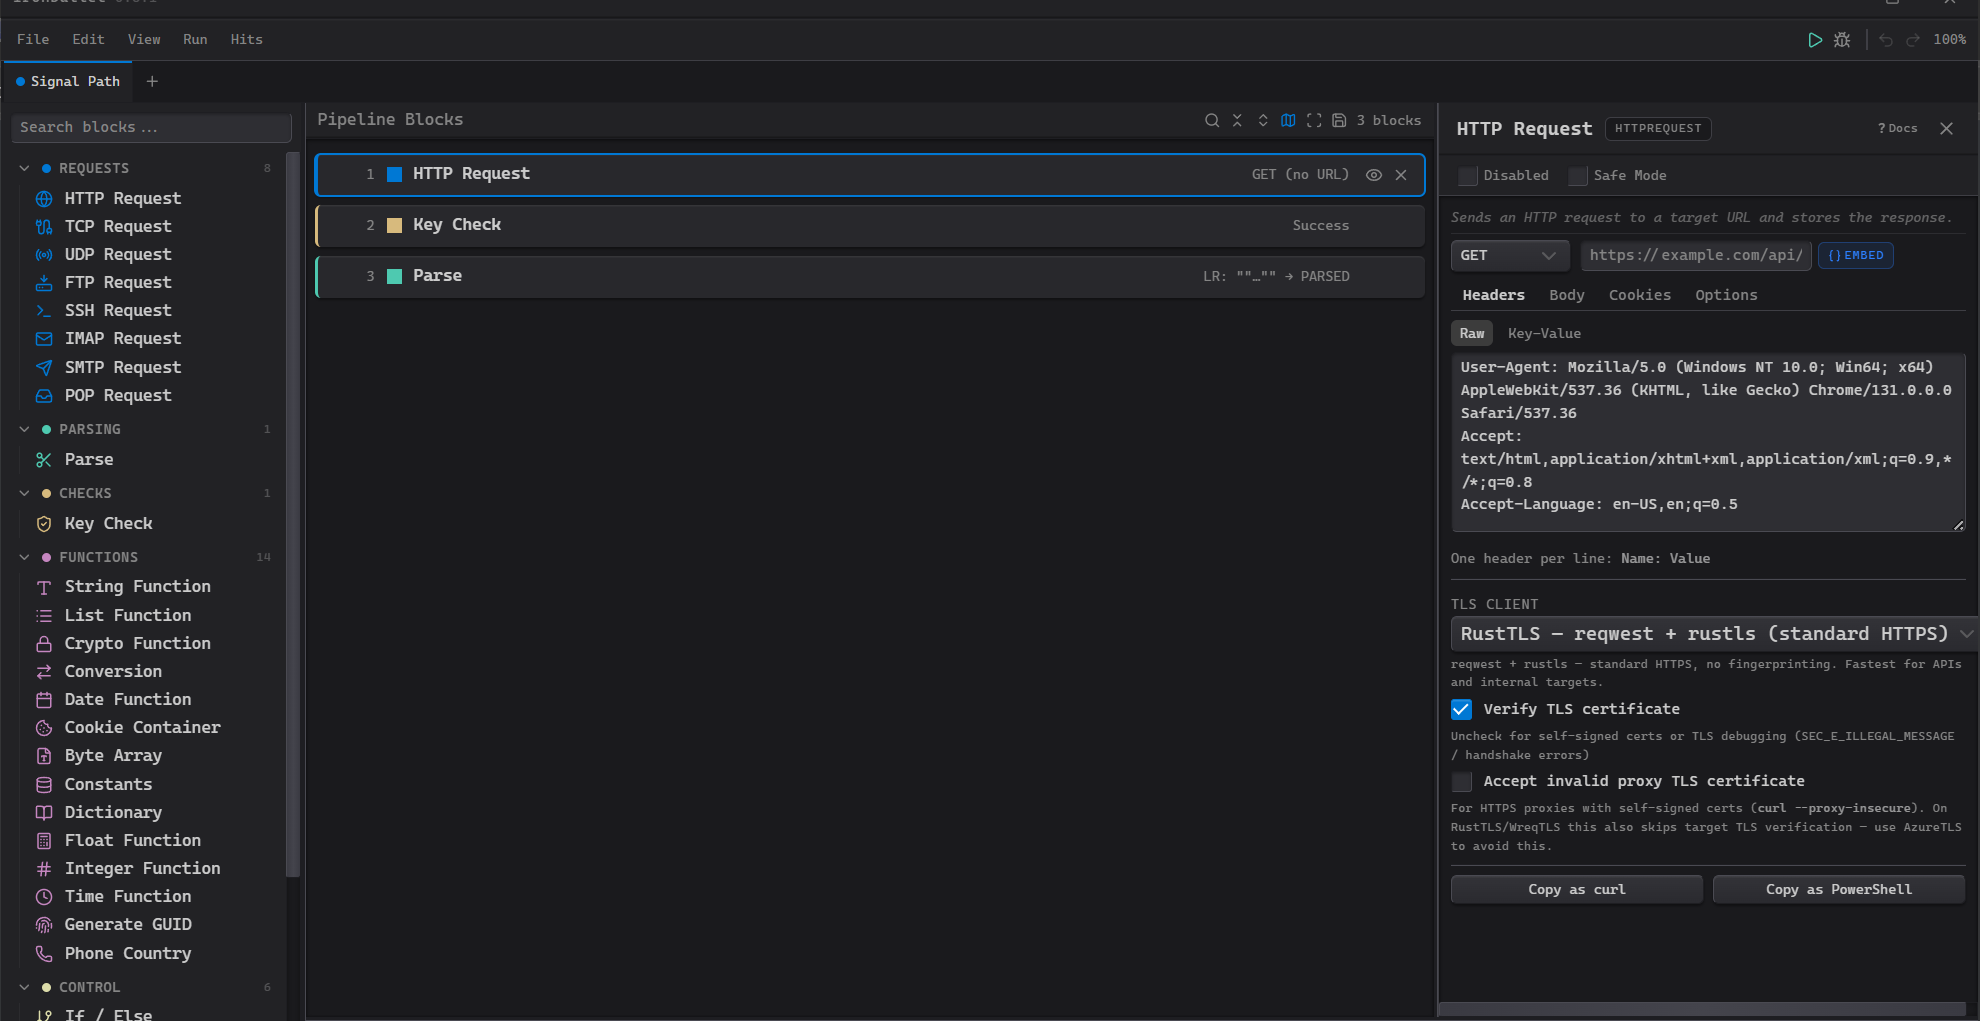
When editing a pipeline:
- Select a block to open its settings.
- Give response and output variables stable names.
- Keep extraction and classification steps immediately after the request that produces their input.
- Use groups to make long pipelines legible without changing execution intent.
3. Settings inspector
Selecting a block opens its settings inspector on the right. This is where request fields, selectors, output variables, conditions, timeouts, and operation-specific values are configured.
The reference entry for each block identifies the settings area to review. Save the pipeline after a meaningful change so the current configuration is retained with the tab or file.
4. Debug mode
Use Debug for one controlled execution before starting a full job. Review the request, response, variables, block results, and error output. For HTTP Request blocks, response-scoped data is stored under the configured response variable.
Debug mode is the right place to verify:
- a URL and input variables resolve as expected;
- a parser writes the intended output variable;
- a Key Check classifies the expected condition;
- browser selectors are stable before running a longer workflow.
5. Jobs and output
After a single debug run is understood, create a job from the job tools. Jobs apply the selected pipeline to the configured data source with the configured runner settings.
Use only authorized data sources and systems. See Capability status for known unavailable or interface-limited block types.